White Paper | Authors: Tashmeet Kaur Magnite, Weng Wai Koh Bytedance, Valerie Jaquet InMobi, Rohan Paul Essence
INTRODUCTION
In the world of advertising, change is a constant theme. This has been especially true over the last years and it continues to be a space of evolution. Today’s digital marketing ecosystem is fast evolving, particularly programmatic growth in the region.
This has led to differing measurement metrics from various types of sources and a lack of standardisation on benchmarks for 3 key areas:
-
-
- Audio
- Video/ OTT
- In-game advertising.
-
In this White Paper we will include guidelines for measurement around the different types of sources, and challenges that end clients may potentially encounter with the ever changing landscape.
Audio
What is Audio Advertising?
Definitions:
1. Broadcast radio: commercial broadcast radio
consumed via cars, traditional radios, desktops in public spaces (eg, cafes)
2. Streaming/digital audio: live radio and music services streamed over the internet – includes services such as Spotify, Apple Music, Soundcloud etc
consumed via desktops, mobile, smart devices, cars
3. Podcasts: spoken word audio in the form of either Original/Narrative Content or Catch Up Radio: available to download via apps like Apple Podcasts, Google Podcasts, Spotify etc
consumed via desktops, mobile, smart devices, cars
This paper will focus on streaming audio and podcasts.
What is driving the increase of audio consumption and audio ads?
-
-
-
-
smart speaker penetration
-
growth of connected cars
-
pandemic-led media consumption.
-
-
-
According to eMarketer, the number of users consuming audio has increased globally (US Proxy) as has the time spent per day listening to audio (US Proxy).
Challenges of measurement (Audio state of the nation 2021
Streaming Audio/Podcast
1. lack of persistent IDs, especially in podcast and smart speakers
2. lack of evidence of effectiveness
3. lack of measurement and tracking/standardisation of metrics
4. difficulty in creating compelling audio creative
Why is Audio Advertising important?
Audio has been playing a more consistent role in media plans over the last five years. We have seen growth in time spent per day listening to audio as well the growth of ad spending across markets globally.
Growth of audio listeners:
Singapore: Digital audio apparently reached a smaller audience in 2021. Two-thirds (66.7%) of internet users surveyed had accessed music, audiobooks, or other audio content via digital platforms in the prior month. But some of this shrinkage may be due to another adjustment in data analysis; unlike past years, GWI did not include Google Play Music in the list of digital music services that respondents were asked about. On the other hand, time spent streaming music rose by 15 minutes daily, to 1:36. Internet users ages 16 to 24 and 25 to 34 continued to post response rates well above average for this metric at 88.8% and 79.0% respectively.
-
Vietnam: About 90% of internet users in Vietnam had listened to digital audio content (such as music, podcasts, or audiobooks) in the month prior to polling this year. Only half as many respondents—44.1%—had listened to live radio during the same period. Similarly, music streaming accounted for an average 1:07 per day, double the 33 minutes devoted to broadcast radio.
-
Thailand: penetration of digital audio—such as music and podcasts—passed 80% in H1 2020 and reached 87.7% among respondents aged 16 to 24. Usage was lowest in the 55 to 64 age bracket, at 65.3% but still far higher than the comparable figures in most countries surveyed.
-
Philippines: Digital audio formats—such as music and podcasts—were also very popular; 87.1% of internet users polled in H1 had listened to such content in the prior month. Music streaming alone accounted for 2:18 daily this year, on average, compared with 2:01 in H1 2020.
-
Malaysia: Seven in 10 internet users listened to broadcast radio in Q1 2021, spending an average 55 minutes each day. Digital audio usage was higher, at 74.6%, and claimed more time as well, at 1:34 daily.
Global Digital Audio Advertising Statistics
-
-
-
ad spending in the Digital Audio Advertising segment is projected to reach US$5,952m in 2021.
-
ad spending is expected to show an annual growth rate (CAGR 2021-2025) of 11.80%, resulting in a projected market volume of US$9,299m by 2025.
-
with a projected market volume of US$3,177m in 2021, most revenue will be generated in the United States.
-
in the Digital Audio Advertising segment, the number of listeners is expected to amount to 1,498.2m users by 2025.
-
the average ad spending per user in the Digital Audio Advertising segment is projected to amount to US$5.28 in 2021.
-
in the Digital Audio Advertising segment, 75% of total ad spending will be generated through mobile in 2025.
-
-
Audio advertising allows you to insert your message programmatically before or during audio feeds such as streaming music, podcasts and news. As a secondary screen to the audio feed, the display can also provide companion video or display ads. The definitions of the channels and formats available are described below:
Channels
1. Music streaming
2. Radio streaming/live radio
3. News streaming
4. Podcasts
Formats
1. Programmatic audio ads -15s/30s spots
2. Interactive audio ads
3. Synchronised audio ads/dynamic audio creative
4. Companion video/display/Call to Action to click on
Based on these common channels and formats, the measurement capabilities are segmented by key marketing objectives.
Metrics that matter
Branding (upper to mid-funnel objectives)
1. Brand Lift: increase awareness, increase interest, consideration, purchase intent
2. Average listening time
3. Number of plays
4. Reach & frequency
5. Audible quartiles
Engagement/Interaction
1. Completion
2. Muted/Unmuted
Basic measurement
1. Companion ads – CTR/CTA
2. Visits to website
In Summary
The continued development and growth of Audio advertising within the industry has been greatly accelerated by its programmatic availability. However, as publishers and platforms continue to find new ways of engaging their audiences on audio, the lack of standardisation may continue to be a hurdle to overcome.
Innovation in spaces such as social audio, footfall or online to offline measurement, and addressable audio that allows for tracking and retargeting of listeners will necessitate attribution beyond inadequate KPIs (such as visits or clicks) to measure scale or campaign effectiveness. These forward looking developments will make it challenging for brands and agencies who are not equipped to correctly measure audio.
Video, OTT
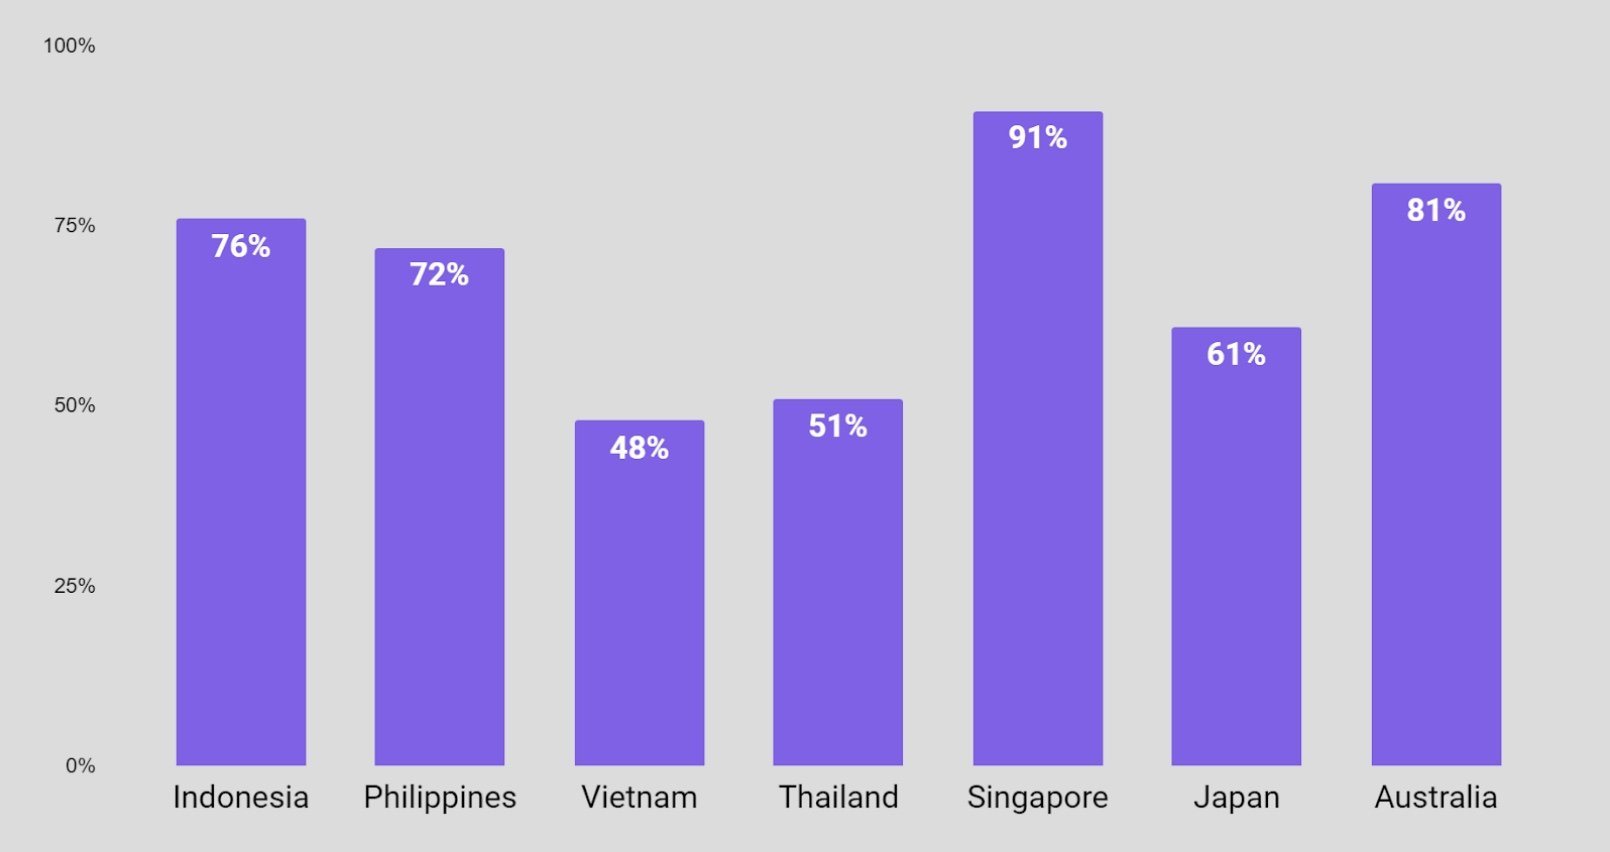
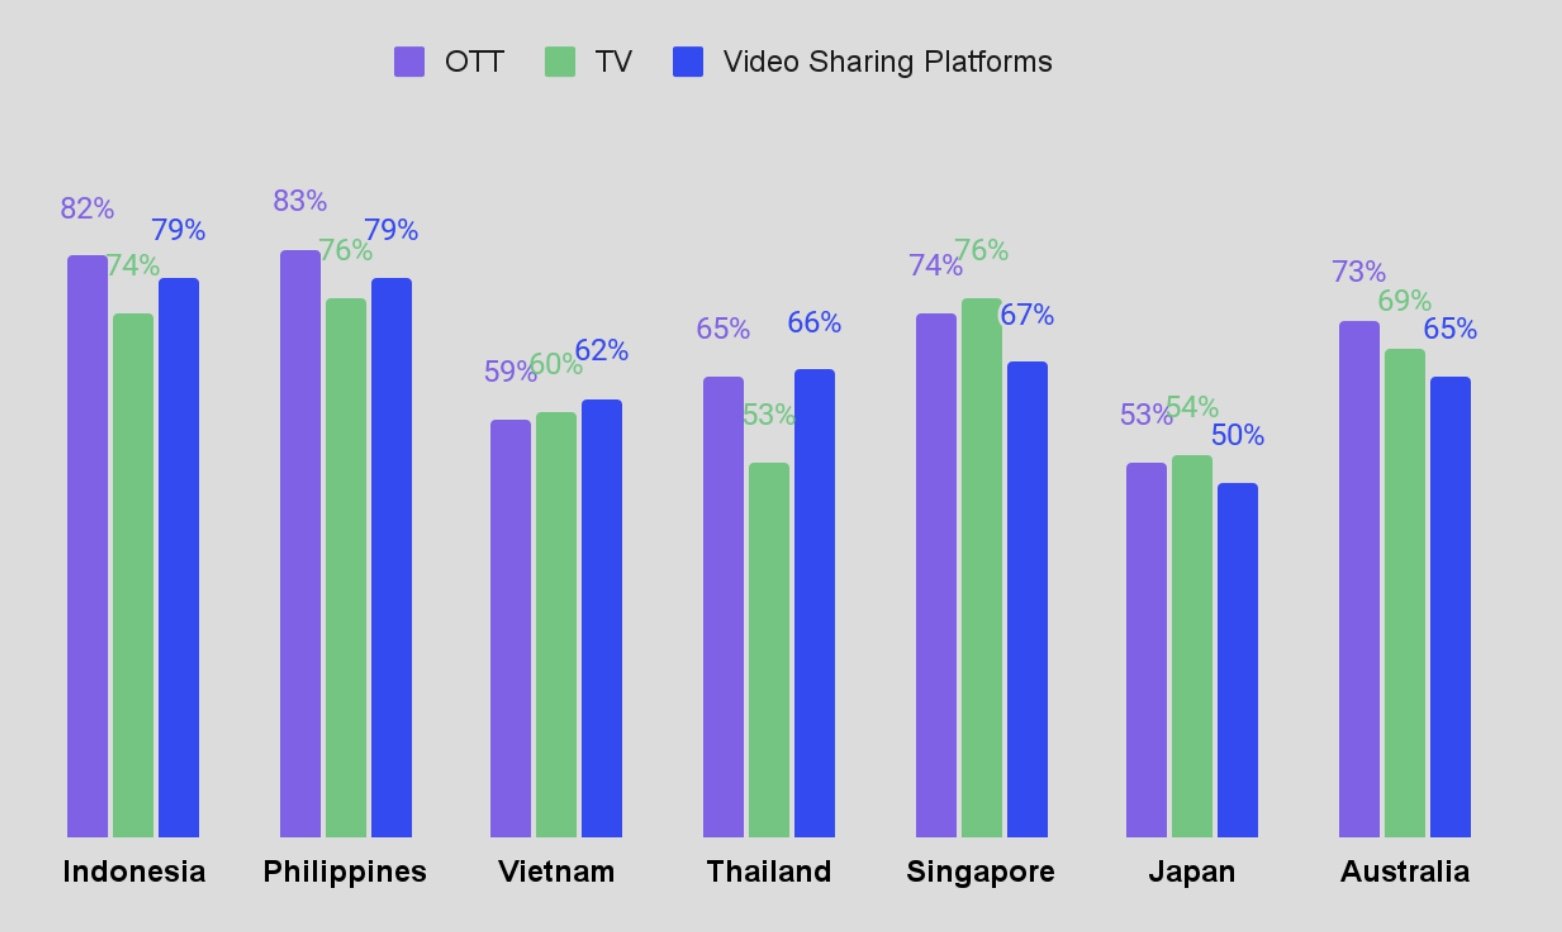
According to Magnite’s OTT Is For Everyone research, OTT viewers are highly engaged in the region with the majority watching more than 2 hours of content per day – higher than time spent with content on TV/video sharing platforms.

Question : Which platforms do you watch video content REGULARLY on (i.e at least once a week)?

Question : On average, how many hours A DAY do you spend watching video content on a WEEKDAY? Data refers to 2 hours or more.
With the rise of CTV and OTT in the region, this has led to the growing trend of customers cancelling their traditional cable and satellite subscriptions in favor of only using these streaming or VOD formats.
The key challenge with growth is that the OTT and CTV landscape is very fragmented with global, regional and local players in the region with differing measurements for each.
Starting with the basics
What is Connected TV (CTV)?
A Connected TV (CTV) is a device that connects to—or is embedded in—a television to support video content streaming.
Different types of CTVs include Xbox, PlayStation, Roku, Amazon Fire TV, Apple TV, Samsung TV and more.
What is Over-the-Top (OTT)?
Over-the-top (OTT) is the delivery of TV/video content directly from the internet. Users can watch this content on various devices—tablet, phone, laptop/desktop, television, etc.
The video is delivered in a streaming or video-on-demand (VOD) format. Different types of OTT services include Netflix, Hulu, Amazon Prime and VIU.
Metrics that matter
In the early years of OTT, fragmentation across the numerous devices, operating systems, and streaming applications made it difficult to efficiently transact in a programmatic environment and this ultimately hurt scale due to inefficiencies in the process.
Fast forward to today, most buyers rely on the IAB and Media Rating Council (MRC) for standardization of measurement across various video formats such as:
-
Outstream Ads
-
Instream Ads – Example: Pre, Mid or Post Roll Ads
-
In Banner Video Ads
-
Interstitial Ads – Example: Floating, Slider Video Ads.
Primary Metrics that matter
-
Delivered Impressions: number of times the creative/ad is displayed
-
Click Through Rate: number of clicks that your creative/ad receives divided by the number of times your ad is shown
-
Completion Rate: number of times that a video plays till the end of the creative duration
-
Measured Rate: represented as a percentage of Viewable Impressions + Non-viewable Impressions / Total Served Impressions,
-
Viewability Rate: measure of whether a creative/ad has been seen by a user (MRC Guideline: Ad has to be 100% in view for 2 seconds or more)
-
Reach & Frequency: number of unique users who view your content.
Secondary Metrics that matter
-
Engagement Rate: Measure the level of interaction by users
-
Conversion Rate: Visit rate
-
Brand Lift Study: Example: Awareness & Consideration,Uplift, Purchase Intent.
Summary
OTT as an emerging channel provides a wealth of information from the audience through interest and viewing habits based on genres and content.
If brands can work with publishers/broadcasters to identify consistent measurement metrics, this will lead to further growth and more precise and accurate targeting.
In-game advertising
How In-Game Advertising Measurement Works
In-game advertising is becoming a game-changer (pun intended) for advertisers. As the ways consumers consume content continue to evolve, disruptive ads are becoming obsolete and less effective. As such, the non-intrusive nature of in-game advertising offers advertisers a great opportunity to create brand interactions that are relevant, engaging, and inspire action.
While in-game advertising is still in its early stages, the sector has been growing by leaps and bounds over the last few years. Technavio’s recent report predicts that the in-game advertising sector is set to grow by USD 3.54 billion between 2021 and 2025.
The Main Advantages of In-Game Advertising
What gives in-game ads the edge over other forms of advertising? Let’s go over them one by one:
-
Better engagement. In-game ads allow for better reach and brand engagement as they are directly integrated and non-intrusive to the gaming experience. An advertisement banner, for example won’t feel out of place when placed on billboards around the stadium in a football game. 1 in 3 players says that in-game ads add to the gaming experience.
-
Discoverability. Gamers are a diverse bunch. Advertisers who want to reach a wider audience that seek to reach a wider audience will do well to use in-game advertisements.
-
Better brand recall. Games offer a highly immersive experience, making in-game ads more memorable than other forms of advertising. Brand recall rates were proven to be high for in-game ads.
Top Challenges Facing the In-Game Advertising Industry
In-game advertising has its fair share of challenges:
-
lack of standardisation of programmatic metrics and
-
concerns involving brand safety and brand suitability.
Metrics that matter
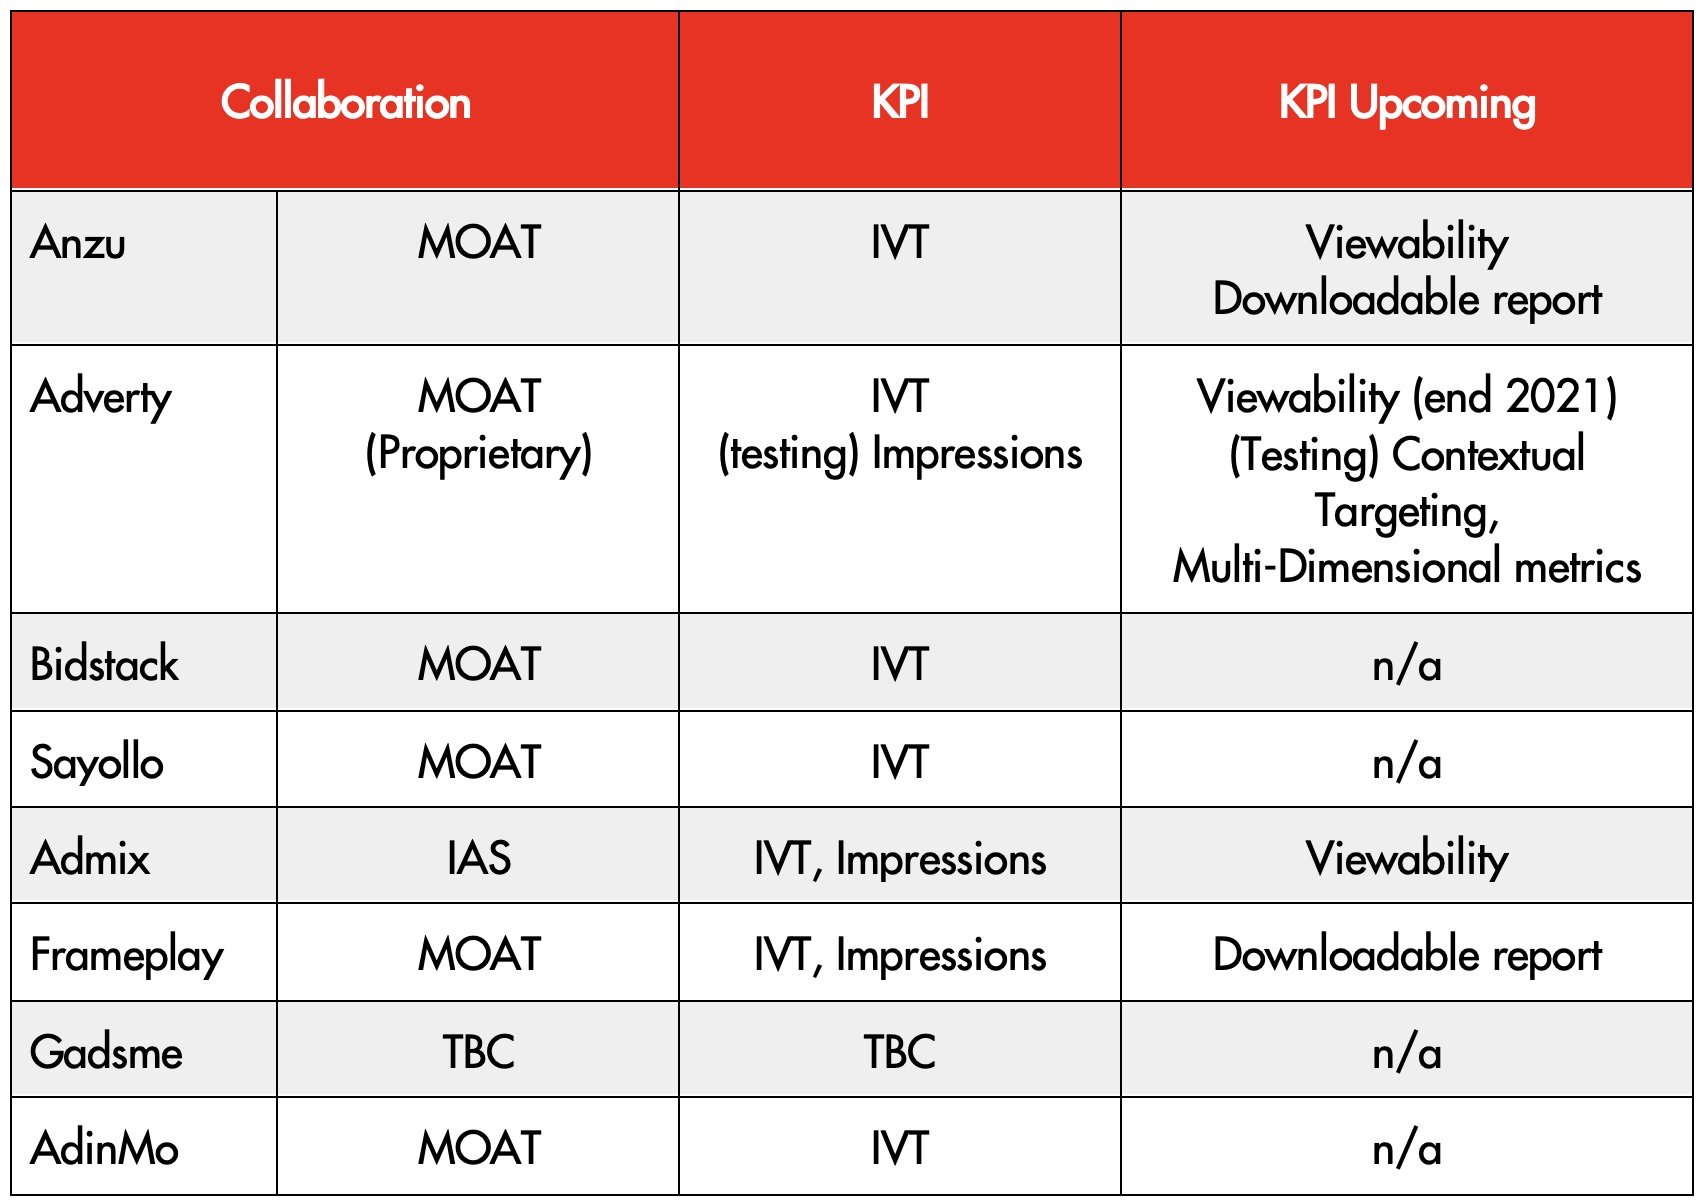
There’s no real consensus or standardised method for measuring the viewability of in-game advertising. For one thing, IAB US guidelines were last updated in 2009 and don’t take into account the technological advances in the years since then. To make up for this discrepancy, some publishers use third-party integration platforms such as MOAT and IAS to measure and track the performance of their in-game ads. However, while these solutions take some of the guesswork out of viewability measurement, their compatibility is limited.

Viewability measurement partners & capability for leading In-Game platforms
Advertisers who choose to adopt the IAB/MRC guidelines use the following KPIs to measure the viewability and effectiveness of their ad campaigns:
Impressions. Due to the dynamic nature of in-game ads, ad impressions can be tricky to measure. An in-game ad must meet the following conditions to count as an ad impression:
-
visibility – minimum ad size should be 1.5% of screen coverage
-
ad angle – the angle of the in-game ad should be no greater than 55 degrees relative to the screen
-
cumulative counting method – an ad impression is equivalent to 10 seconds of cumulative view time, with each ad exposure adding to it not less than .5 seconds.
Reach. The number of unique users who saw the in-game ad over a certain reporting period.
Frequency. The number of valid ad impressions that occur over a specific period to the average user. It is recommended that all pertinent information such as reporting period and accumulation method used should be disclosed.
Brand Safety & Brand Suitability: In-Game placements as a Brand Suitable Environment
Advertisers who want to try in-game ads often need to come to terms with the question, “Are games a safe place for brands to post their ads?”
66% of consumers are likely to abandon a brand when their ads appear alongside negative content. No wonder many brands are losing sleep over brand safety.
The problem with brand safety measures is that they are often restrictive, forcing brands to block categories and keywords which then limits their reach. Real trust will only come once the industry can align on universal tracking and measurement that moves with the pace of change of the industry.
This is where brand suitability comes into the picture. Brand suitability goes beyond brand safety, considering context and relational factors specific to a brand’s values and needs.
With brand suitability, instead of focusing solely on avoiding ad placements that might harm your brand, you focus on touch points within the game where you can communicate your brand message in ways that resonate with your audience.
Here are five ways you can establish brand suitability in your in-game advertising campaigns:
-
Make your in-game ad placements authentic and relevant to your target audience.
-
Leverage positive moments in games to boost affinity for your brand.
-
Increase the touch points in your brand-consumer relationship by taking advantage of the diverse elements in gaming content.
-
Reach diverse consumers by using diversity in gaming content to your advantage.
In Summary
In-game advertising is changing the game, and it’s only going to get bigger thanks to the continuous growth of programmatic technology and mobile gaming. While in-game advertising has its fair share of challenges, the space is brimming with growth opportunities. As long as you leverage the immersive nature of video games and deliver brand experiences that don’t disrupt the user experience, you’re on the right track.

